Continuing our tour through the various NHL divisions, it's time to focus on the Central Division, which for the last several years has served as Detroit's personal happy place (five straight 1st-place finishes), but this year is in danger of going Country, as the Nashville Predators currently stand at the top of the overall NHL standings, with the Red Wings four points back. Both teams have flown under the hockey world's radar in light of Buffalo and Anaheim's hot starts, but are legitimate President's Trophy contenders. The rest of the division has generally played the role of the Washington Generals for Detroit and Nashville over the last couple years, but after recent coaching changes, there is at least hope for competitive balance to return to what was once the close-knit Norris Division of old. Unfortunately I don't have time today to post graphs for all five teams in the division, so I'll focus on Nashville & Detroit for now.
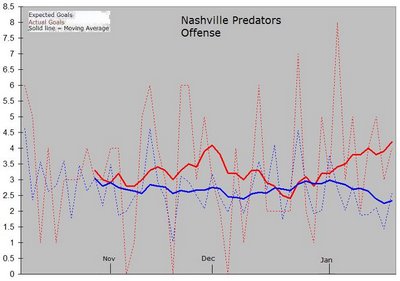
NASHVILLE PREDATORS: Over the course of the season so far, the Predators have generally boasted an Actual Goals per Game trend that tracks well above the Expected value, based on the quantity and quality of shots taken. That would appear to indicate that Nashville's team shooting is among the best in the league. Based on shot type and distance, and average opposing goaltending, they would be expected to have 129 goals at this point, but instead have 163 (3rd in the NHL). This phenomenon appears to be broad-based as well, as out of the seven players with at least ten goals, only one (J.P. Dumont) isn't significantly outperforming his Expected Goals value. As a team they've been ridiculously hot of late, but those sage predictions of offensive depth appear to be bearing fruit.
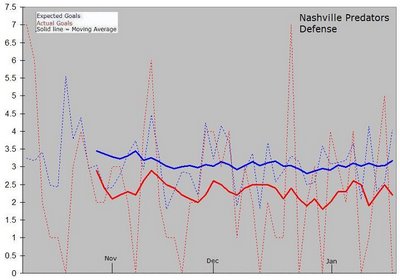
Defensively, we have a picture that "backup" netminder Chris Mason needs to take into his next contract negotiation. Note how the Actual Goals Against per game line consistently glides along more than 0.5 goals per game lower than Expected Goals Against. When starter Tomas Vokoun went down with a hand injury in late November, he was among the league leaders in the various goaltending categories, but then Chris Mason stepped in and didn't miss a beat, posting a .931 save percentage in 30 games. No other team in the league has this kind of depth to take into the playoffs, period. In terms of impact, that half-goal per game difference makes the difference between Nashville being the 7th-best team in Goals Against, and being down at 19th spot alongside the Rangers and Blues.
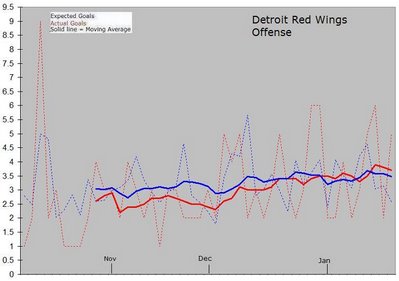
DETROIT RED WINGS: This is one of the least interesting graphs we'll see in terms of striking swings or gaps in direction or another, but that is precisely what makes it so remarkable. The Red Wings haven't been shut out all year, and haven't had a one-goal game in the last two months. They've climbed about 0.5 goals per game since October/November, but it's been much more of a gradual process (which appears sustainable) than some spike due to a fortunate streak in the schedule.
At their own end of the rink, the results have been much the same. The skaters have kept Expected Goals Against right around 2.5 per game (outstanding), and the goaltending has been average to moderately above average most of the time. Apprently, part of the secret to keeping your 42 year-old goaltenders fresh is to make sure they face the fewest shots in the league...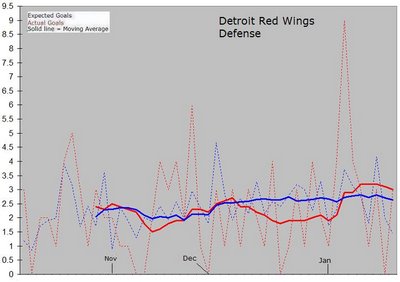
NASHVILLE PREDATORS: Over the course of the season so far, the Predators have generally boasted an Actual Goals per Game trend that tracks well above the Expected value, based on the quantity and quality of shots taken. That would appear to indicate that Nashville's team shooting is among the best in the league. Based on shot type and distance, and average opposing goaltending, they would be expected to have 129 goals at this point, but instead have 163 (3rd in the NHL). This phenomenon appears to be broad-based as well, as out of the seven players with at least ten goals, only one (J.P. Dumont) isn't significantly outperforming his Expected Goals value. As a team they've been ridiculously hot of late, but those sage predictions of offensive depth appear to be bearing fruit.
Defensively, we have a picture that "backup" netminder Chris Mason needs to take into his next contract negotiation. Note how the Actual Goals Against per game line consistently glides along more than 0.5 goals per game lower than Expected Goals Against. When starter Tomas Vokoun went down with a hand injury in late November, he was among the league leaders in the various goaltending categories, but then Chris Mason stepped in and didn't miss a beat, posting a .931 save percentage in 30 games. No other team in the league has this kind of depth to take into the playoffs, period. In terms of impact, that half-goal per game difference makes the difference between Nashville being the 7th-best team in Goals Against, and being down at 19th spot alongside the Rangers and Blues.
DETROIT RED WINGS: This is one of the least interesting graphs we'll see in terms of striking swings or gaps in direction or another, but that is precisely what makes it so remarkable. The Red Wings haven't been shut out all year, and haven't had a one-goal game in the last two months. They've climbed about 0.5 goals per game since October/November, but it's been much more of a gradual process (which appears sustainable) than some spike due to a fortunate streak in the schedule.
At their own end of the rink, the results have been much the same. The skaters have kept Expected Goals Against right around 2.5 per game (outstanding), and the goaltending has been average to moderately above average most of the time. Apprently, part of the secret to keeping your 42 year-old goaltenders fresh is to make sure they face the fewest shots in the league...
Tags: