Today we'll begin with the Northwest Division, that morass of mediocrity that currently shows all five teams within a mere four points in the standings. Will things stay this close over the next few months, or will a team or two start to take the lead? What I'll do here is merely lay out the trends, and leave it up to you to provide comments as to what may have provided the trigger for some of the key turning points we'll see along the way. I'm not close enough to all these teams to know which lines got juggled when, who missed certain games due to injury, etc. For clarity's sake, the red lines represent actual goals (solid line is the 10-game moving average), and blue lines show Expected Goals (Shots * Average Shot Quality).
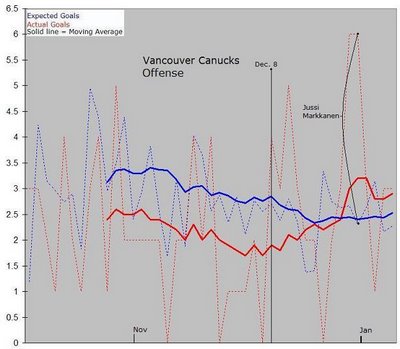
VANCOUVER CANUCKS: The story in B.C. seems to be that the Canucks weren't finishing their scoring opportunities early on, as their Actual Goals underperformed relative to Expected Goals by upwards of a full goal per game for weeks. What we have since then is really a mixed bag offensively, as the Expected Goals has taken a dip, residing now around 2.75 goals per game, but the Actual Goals have exceeded that figure, in part due to an outstanding effort in a 6-2 drubbing of the Edmonton Oilers on December 30th, when Jussi Markkanen yielded 6 goals on 25 shots (the gap noted in the picture shows the difference between actual and expected goals on that night).
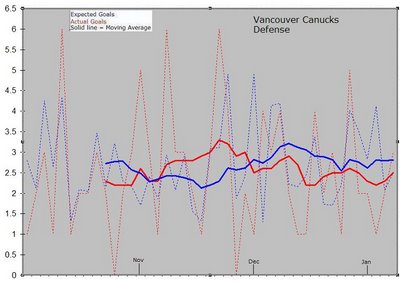
Defensively, the picture looks much more consistent. Both Expected and Actual Goals against have mostly hovered between the 2.5 and 3.0 goals per game marks, with no discernable trend either up or down there.
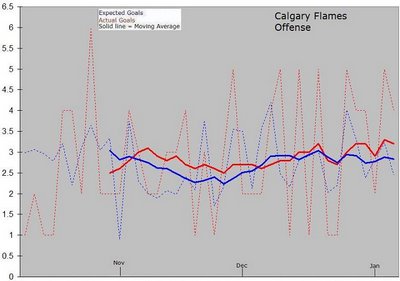
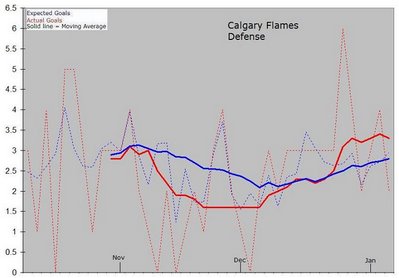
CALGARY FLAMES: The Flames offense has been one of the more consistent, if not spectacular, groups in the league. The Expected Goals average never seems to top 3 goals per game, casting doubt on any offensive surge unless something significant changes, either in personnel or tactics:
On the defensive side, the Flames really locked things down during November and December, at first through outstanding goaltending (note the gap between the blue and red lines), then later through solid team D, as the Expected Goals Against line hung at or below 2.5 goals per game for about a month. Taking both of these charts together, we see a team giving up and scoring about the same amount of goals, so there's nothing here to indicate the Flames are about to heat up.
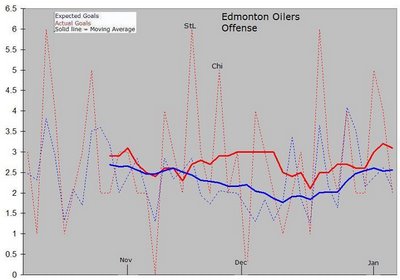
EDMONTON OILERS: Now this is an interesting chart. Notice how in mid-November, the Expected Goals heads into the toilet (troughing below the 2 goals-per-game level), before picking back up around the new year. During that time, however, the Actual Goals actually held up, bouyed by a couple strong efforts against St. Louis and Chicago (noted in the chart). Were the Oilers catching a fortunate streak against lousy goaltending during that time, or did they focus more in light of Ryan Smyth's injury? Speak up, Oilers fans...
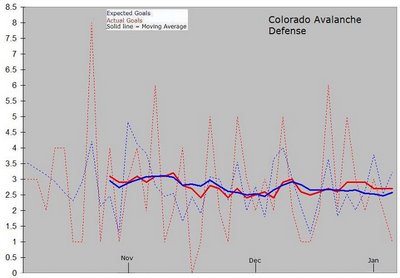
COLORADO AVALANCHE:
On the attack, Colorado's Expected Goals trend has declined slowly from elite (4.0 goals per game in early November) to average (around 3.0 now), leaving little optimism for a sudden revival anytime soon. During the last two weeks of November, Actual Goals were especially hard to come by, and while those blue and red trend lines are running close together now, the steady slope downwards cries out for some kind of action from team management.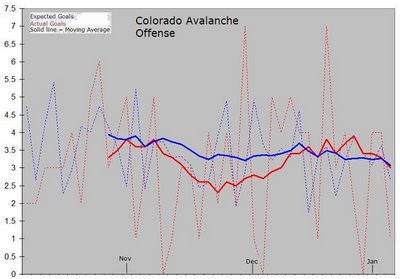
On defense, the Avalanche have been a model of consistency, lingering mostly in the 2.5-3.0 goals against per game pace all season, with actual results closely conforming to expectations. That sort of reliability could help them avoid prolonged slumps over the next couple months, and keep them contending for the division lead.
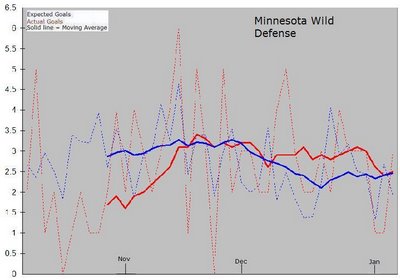
MINNESOTA WILD: There may be reason for hope in Minnesota, as the offense is producing as well as they have all year (right around the NHL average), and the trend appears headed in the right direction. Actual results are closely tracking expectations, so the recent surge appears to be the product of solid team effort, rather than just loading up goals in a fluke blowout or two.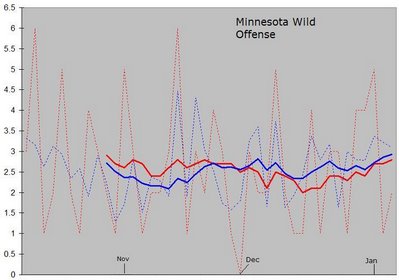 And on defense, the final graph in this piece provides probably the strongest case for a potential leader to come out of this tightly-bunched division. Team defense is yielding a stingy 2.5 Expected Goals against per game, and with Actual Goals closely in step at this point, it looks like the goaltending is holding up its end of the bargain as well (certainly in early November it did, when Actual Goals were well below Expected). An average offense, combined with outstanding defense, can pile up plenty of points over the course of the long NHL season. Just looking at these trends, I'd place my bets on the Wild to charge out to the Northwest division lead over the next few weeks...