As we approach the end of the year, I thought I'd look back at a previous post, and examine to what extent any (or all) of the predictions made are actually bearing fruit. Back in November, I looked at Expected Win % as a function of Goals For and Goals Against, comparing each team's actual winning percentage against what the PythagenPuck formula would predict. Typically, if you've got the team-by-team Goals For and Against numbers across an entire season, PythagenPuck calculates a winning percentage that is within 2-3% of actual results. As a simple example, if you have a team that's getting outscored on average, but is over .500 (by winning close games and losing by blowouts), it's a good bet that if that scoring trend holds, the win/loss record will sink below .500 over time.
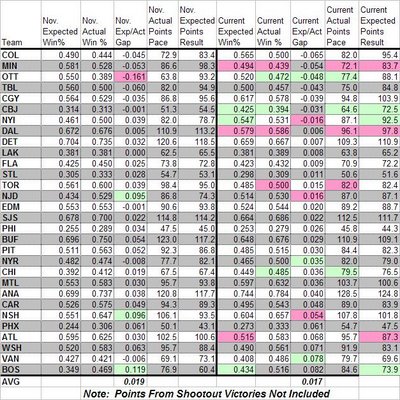
The numbers from last month (when teams had played 16-21 games) basically indicated that the disappointing Ottawa Senators were due for a rebound, as they were the runaway underperformers in the NHL, whereas Boston, Nashville, and New Jersey stood out as being overperformers. In other words, they were winning more games than you'd expect, based on their Goals For/Against ratio. The table below reflects those figures along with updated numbers as of the games of 12/21, with teams having played 32-37 games each, roughly twice as many as from the initial analysis.
The "Nov. Exp/Act Gap" shows the difference between the actual winning percentage, and that predicted by PythagenPuck, with the underperforming Ottawa Senators shaded pink, and the overachievers shaded green. And remember, I've removed points from Shootout Wins from these numbers. You can count on anywhere from 0-10 points from SO Wins in any given season, but I'll be damned if I can figure out how to predict it.
Looking at the Current side of the table, we have updated information. The 3 teams shaded green in each column are those whose numbers have improved the most since the November article, whereas the 3 teams with steepest declines are shaded pink. So here's a few observations:
Current Expected Win %: The big leap here has been made by the Columbus Blue Jackets, who have improved their Goals For and Goals Against by about a third of a goal per game each since Gerard Gallant was let go as coach. The Boston Bruins and New York Islanders have also made huge improvements as well. On the downside, the Dallas Stars have cooled off considerably, going from .672 to .579. This has almost entirely been due to a defense that started off with a ridiculously low 1.8 Goals Against/Game, which has now crept above 2.2 (still outstanding, but not freakishly so). Minnesota and Atlanta have seen offensive dropoffs, leading to their lowered results here.
Current Actual Win %: Again, the biggest jump is by Columbus, as expected by their improvement in GF/GA. Look at the Ottawa Senators, though. Their Win % has jumped from .389 to .472, even though their GF/GA ratio has worsened slightly! That's because the Gap between Expected and Actual has closed from -.161 to -.048, which is a much more normal figure. They've been playing decently all along, and now "the breaks" are rewarding those efforts. Granted, they're not a 100-point team, but at least they have a shot to make the playoffs. The biggest fall has been by the Toronto Maple Leafs, caused mostly by a Goals Against figure that has jumped about 10% (3.34 vs. 3.05 in November).
Current Exp/Act Gap: As noted before, the faraway winner here is the Senators, who were horribly snakebit early, and are now only modestly so. Losing Jason Spezza to injury won't help in the short term, but again, at least they're in the playoff mix. The other major upside move was made by Vancouver. Yup, that's right, Canucks fans, you should consider yourselves incredibly lucky to have a 17-17-1 team!
Another note about that Current Exp/Act Gap column is that the teams at the top are currently underperforming, while those at the bottom are overperforming. So the Avalanche, Wild, and Senators should expect their fortunes to improve if they keep up their GF/GA pace, while the Capitals, Canucks, and Bruins will likely revert closer to their Expected Win % unless things radically change. Note, in particular, how the Bruins are in the process of coming back to the pack. In November, their Gap was 0.119, while today it has closed to 0.082.
Going back to the predictions from that November piece, I'd say the Senators prediction has largely come to pass. Despite slightly worse numbers for Goals For and Against, their actual winning percentage shot up by 83 points. As to the teams that were overachieving at that time, the New Jersey Devils, Boston Bruins, and Nashville Predators have significantly improved their GF/GA ratio, which has brought their Expected Win % up closer to their actual numbers. It's interesting to note that of these 4 "extreme" teams from November, three of them posted the biggest "gap shrinkage", meaning that those outlying cases are indeed trending back towards the PythagenPuck prediction.
I'll check back again on this closer to the three-quarter point of the season, and if I had to make a call today, I'd take a stab and say that Calgary and Colorado should start to pull away from the pack in the Northwest, Anaheim should continue stretching out their lead in the Western Conference, and Washington will start to fade from playoff contention. The cracks in their defense are becoming ever more apparent, and are probably to severe for Olie Kolzig to carry this team all the way into the top eight in the East.
