Every parent thinks they are prepared for this question, but when your child brings it up for the first time, it never fails to catch you off your guard. Do I go for the old "stork" tale? Do I pull out diagrams, or use dolls? The mind shudders when you hear the words...
"Daddy, where do goals come from? "
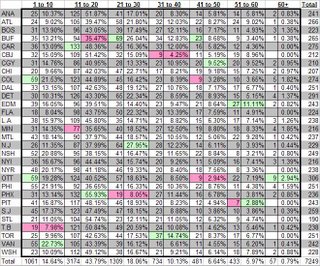
Rest assured, dear readers, you now have your answer. To be precise, 58.4% came from within 20 feet last season, and only 6.76% came from beyond 50 feet. Drilled down on a team-by-team basis, we see standouts like the Atlanta Thrashers, who scored a league-low 48.4% of their goals from inside 20 feet, whereas the Phoenix Coyotes worked in close for a league-leading 69% of their tallies. If you look at the Buffalo Sabres, they scored less often than most within 20 feet (48.6%), but they scored a league-high 69 goals in the 21-30 foot range. Another interesting case is the Edmonton Oilers, who sniped almost 12% of their goals from beyond 50.
Take a look at the attached chart (click on it to enlarge), print it out, and chew over it for a bit with your friends during your next wine & cheese black-tie gala (err... beer & wings outing at the pub). For clarification purposes, this covers 99.8% of all goals scored last year (for some reason a couple games were left out of my data extracts), and I also excluded Empty Net goals from the figures. The percentages next to each value are the percent of each team's goals that came from that given distance.
Coming soon - similar data broken down by shot type, and then the real fun begins. We'll look at how the different goalies perform against these criteria...
EDIT NOTE: I noticed that there were a disproportionate number of 10 ft. goals in the extract, which I suspect has been used in cases when the goal came within 10 feet. So I've changed the columns to 1-10, 11-20, etc. to correct for this.
