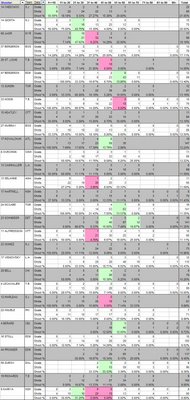
So who's got the best slap shot in the game of hockey? Well, according to shooting percentage on slap shots only, the answer would appear to be (drum roll, please...) Jonathan Cheechoo of the San Jose Sharks. Last season, Cheechoo scored on 21% of his slapshots, well above the league average of 7.51% for all slapshots, as found in yesterday's article covering Scoring Percentage by Range and Shot Type. Particularly notable with Cheechoo is his 27% scoring rate from the 31-40 foot range, which means he didn't just load up with cheap goals in close to obtain his lofty results (although he did certainly load up within the 10-foot mark).
The interesting thing to note here is the validation that the top goal scorers don't just get their numbers due to taking lots of shots, but that they do appear to score more often when they do shoot. Guys like Jaromir Jagr, Ilya Kovalchuk and Alexander Ovechkin (who ranked 3rd, 5th, and 6th last year in total ice time for forwards) also rank highly in slap shot scroring, at #3, #11, and #12 respectively.
For this study, I screened for the top 100 players from last season in terms of slap shots taken, broke down the results based on range, and summarized to obtain individual scoring percentages as shown in the picture below. Empty Net goals are not included in these figures, and I've highlighted some of the more interesting cells where percentages are high (green) and where they are abnormally low (red).
Just click the picture below to enlarge.
