Here's your Thursday afternoon dose of interesting NHL information. The table below shows all 2005-2006 regular season goals (non-empty net), broken down by shot type and distance. No wonder wrap-arounds always make the highlights, they account for less than 1% of all goals! The highest frequency here is for wristers from 11-20 feet, of which 1,278 were scored accounting for 17.63% of the total.

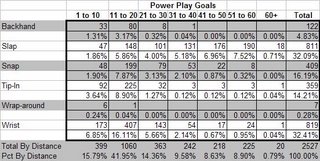
The second table is a subset of the first, screening only for Power Play goals. The interesting fact here is that the portion of medium- to long-range goals goes up on the power play, as teams work the puck around for a clear shot from the point (also supported by the higher incidence of slapshot goals, at 32% vs. 24.5% overall). For the overall totals, about 12.6% of goals came from 40-60 feet, whereas on the power play, 17.5% of goals came from that range.
Look for most posts over the weekend, as we break down team-by-team performance in this area, including save percentage by distance and shot type...
