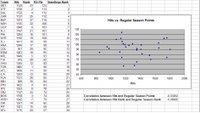
In the wake of Bobby Clarke's resignation in Philadelphia, I thought it would be interesting to dig up the total hits dished out by NHL teams last season, and throw that up against their regular season standings to see if there's any correlation between physicality and victory. By the looks of things, time has passed Mr. Clarke by, and hits don't bear any direct result on wins and losses.
The picture below (click to enlarge) outlines the total hits dished out by each team during the 2005-6 Regular Season, compared against their Regular Season point totals. As you can see, the distribution is pretty widespread, with physical leaders like Ottawa(!) and Dallas enjoying triple-digit totals in the standings, while being closely followed by Carolina and Buffalo, who were near the back of the pack in terms of hits. At the bottom end of the standings, you have a similar mix of hockey teams with various amounts of hits.
The correlation values are close enough to 0 to be basically irrelevant, with a result of -0.03 for Hits vs. Regular Season Points. A value of 1 means that the two statistics march up and down together perfectly, whereas a -1 means they move in completely opposite directions. Near 0, the value means there no specific relationship between the two. Edited for clarity 10/26/06.
Coming soon, a followup in this fashion looking at other portions of the game...
