So who are the best defensive teams in the NHL this year? A quick look at the Goals Allowed standings is a decent place to start, but if we dig into the details of shots given up by each team (both quantity and quality), we get a better picture of which teams are truly locking down their opponents, and which ones are getting bailed out by stellar goaltending. The folks over at Hockey Analytics first looked into this area back in 2004, and I'm taking a look at the 2006-7 NHL Regular Season to date here.
First, a quick guide through the columns, then we'll get to the analysis:
Team: A bunch of guys who get paid a king's ransom to play the greatest game on earth. If you actually needed to read this, I'm guessing your Googling has gone pretty far awry...
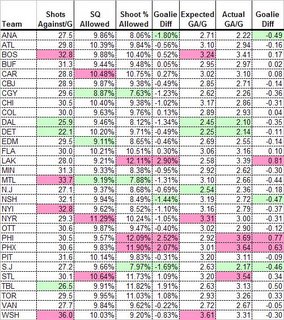
Shots Against/G: Shots Against Per Game, straight off of NHL.com as of Sunday night.
SQ Allowed: This is the average Shot Quality allowed on each shot by a given team. I'm using my values which probably vary slightly from what the Hockey Analytics folks would use, but the difference should be negligible. As an example, a wrist shot from within 10 feet of the net has a SQ of 24.79%, as that percentage of those shots scored overall during the 2005-6 season. The higher this number, the more dangerous are the shots that a team is giving up.
Shoot % Allowed: This is the shooting percentage against a given team.
Goalie Diff: This shows the difference in opponents' shooting percentage and Shot Quality Allowed. Where those numbers are negative, that suggests the goaltenders are stopping more shots than you'd expect from an average NHL performance.
Expected GA/G: This is simply Shots Against/Game times SQ Allowed, which gives us the Goals Against you'd see from average NHL goaltending.
Actual GA/G: Goals Against Per Game, straight off of NHL.com.
Goalie Diff: This "Goalie Diff" column shows the difference in goals allowed between actual and an average NHL goaltending performance. This varies from the earlier "Goalie Diff" column based on the number of shots that a team allows.
The top 3 teams in each column are shaded green, while the worst 3 are shaded pink.
So what do the numbers tell us here?
On the team defensive front, we usually look at Shots Against as a reliable guide, and it's a generally useful stat. By adding in Shot Quality, however, we see a team like the Montreal Canadiens, who give up the 2nd-most shots per game (33.7), but have the 3rd-best SQ Allowed. The Canadiens just aren't allowing as many shots from prime scoring locations, and with the benefit of standout goaltending as well, their Goals Against is a reasonable 2.66, slightly below the league average of 2.88! At the other end of that scale, we see that some teams may give up relatively few shots, but those shots are particularly dangerous (like Carolina and the New York Rangers). The true standouts in this two-pronged view of team defense are to be found in the Expected GA/Game column, where teams like the Calgary Flames jump from merely average in Shots Against to 5th-best, based on the quality of the shots they're giving up.
Switching over our view to goaltending, you have to feel for blueliners on the Los Angeles Kings. Their SQ Allowed is a very respectable 9.21% (4th-best), but opponents are shooting a league-best 12.11% against them. Dan Cloutier has been particularly disastrous so far (.865 save percentage), while Mathieu Garon has been middling at best. The silver lining here is that perhaps if they could improve the situation in net, things could turn dramatically for the club. The rest of the pieces are in place for a stingy Goals-Against, but the goaltending is letting them down.
Similar goaltending quagmires abound in Philadelphia and Phoenix, but that's hardly news (Dead Horse, meet Mr. Stick). Tampa Bay, St. Louis, and Toronto also are allowing a full percentage point higher shooting percentage than should be expected, so at least for the Maple Leafs, they have more than just a recent lack of offense to blame for their woes. If you look at the Lightning, you'll see they boast a wonderful Shots Against/Game figure (26.5, 3rd best), but shoddy work in net puts them in the middle of the pack in Goals Against. It makes one wonder how the locker room morale will hold up in such a situation - will the team continue to battle in front of their lackluster backstop, or vent frustration over seeing their hard work go to waste when another weak shot goes in?
On the positive front, the biggest stories are in Anaheim, San Jose, and Nashville, where goaltending is shaving nearly a half goal per game off of what would otherwise be expected. Top defensive teams like Detroit and Dallas (1st and 2nd in Shots Allowed) benefit from above-average goaltending as well, pushing their GA/Game down near the 2.00 mark.
So take a look at your favorite team's results, and ponder where the room for improvement lies on the defensive end. Are they giving up lots of shots? Are they dangerous shots? Is the goalie holding up his end of the bargain? Every team's got a hole somewhere...
Click to Enlarge
First, a quick guide through the columns, then we'll get to the analysis:
Team: A bunch of guys who get paid a king's ransom to play the greatest game on earth. If you actually needed to read this, I'm guessing your Googling has gone pretty far awry...
Shots Against/G: Shots Against Per Game, straight off of NHL.com as of Sunday night.
SQ Allowed: This is the average Shot Quality allowed on each shot by a given team. I'm using my values which probably vary slightly from what the Hockey Analytics folks would use, but the difference should be negligible. As an example, a wrist shot from within 10 feet of the net has a SQ of 24.79%, as that percentage of those shots scored overall during the 2005-6 season. The higher this number, the more dangerous are the shots that a team is giving up.
Shoot % Allowed: This is the shooting percentage against a given team.
Goalie Diff: This shows the difference in opponents' shooting percentage and Shot Quality Allowed. Where those numbers are negative, that suggests the goaltenders are stopping more shots than you'd expect from an average NHL performance.
Expected GA/G: This is simply Shots Against/Game times SQ Allowed, which gives us the Goals Against you'd see from average NHL goaltending.
Actual GA/G: Goals Against Per Game, straight off of NHL.com.
Goalie Diff: This "Goalie Diff" column shows the difference in goals allowed between actual and an average NHL goaltending performance. This varies from the earlier "Goalie Diff" column based on the number of shots that a team allows.
The top 3 teams in each column are shaded green, while the worst 3 are shaded pink.
So what do the numbers tell us here?
On the team defensive front, we usually look at Shots Against as a reliable guide, and it's a generally useful stat. By adding in Shot Quality, however, we see a team like the Montreal Canadiens, who give up the 2nd-most shots per game (33.7), but have the 3rd-best SQ Allowed. The Canadiens just aren't allowing as many shots from prime scoring locations, and with the benefit of standout goaltending as well, their Goals Against is a reasonable 2.66, slightly below the league average of 2.88! At the other end of that scale, we see that some teams may give up relatively few shots, but those shots are particularly dangerous (like Carolina and the New York Rangers). The true standouts in this two-pronged view of team defense are to be found in the Expected GA/Game column, where teams like the Calgary Flames jump from merely average in Shots Against to 5th-best, based on the quality of the shots they're giving up.
Switching over our view to goaltending, you have to feel for blueliners on the Los Angeles Kings. Their SQ Allowed is a very respectable 9.21% (4th-best), but opponents are shooting a league-best 12.11% against them. Dan Cloutier has been particularly disastrous so far (.865 save percentage), while Mathieu Garon has been middling at best. The silver lining here is that perhaps if they could improve the situation in net, things could turn dramatically for the club. The rest of the pieces are in place for a stingy Goals-Against, but the goaltending is letting them down.
Similar goaltending quagmires abound in Philadelphia and Phoenix, but that's hardly news (Dead Horse, meet Mr. Stick). Tampa Bay, St. Louis, and Toronto also are allowing a full percentage point higher shooting percentage than should be expected, so at least for the Maple Leafs, they have more than just a recent lack of offense to blame for their woes. If you look at the Lightning, you'll see they boast a wonderful Shots Against/Game figure (26.5, 3rd best), but shoddy work in net puts them in the middle of the pack in Goals Against. It makes one wonder how the locker room morale will hold up in such a situation - will the team continue to battle in front of their lackluster backstop, or vent frustration over seeing their hard work go to waste when another weak shot goes in?
On the positive front, the biggest stories are in Anaheim, San Jose, and Nashville, where goaltending is shaving nearly a half goal per game off of what would otherwise be expected. Top defensive teams like Detroit and Dallas (1st and 2nd in Shots Allowed) benefit from above-average goaltending as well, pushing their GA/Game down near the 2.00 mark.
So take a look at your favorite team's results, and ponder where the room for improvement lies on the defensive end. Are they giving up lots of shots? Are they dangerous shots? Is the goalie holding up his end of the bargain? Every team's got a hole somewhere...
Click to Enlarge
